If you have been searching for solar panels Kelowna, you have probably seen quotes that highlight a big peak number. But does a 6 kW system really mean 6 kW every sunny hour? Not quite. The Okanagan gets genuinely strong sunshine, yet real output swings with winter snow, summer wildfire smoke, roof pitch, orientation and shade. That is why the number to judge is your annual production estimate, not a nameplate rating. In this beginner tutorial, we will cover why a nameplate rating is not your Kelowna production number, how solar panels work in plain terms, and what the Okanagan's strong irradiance actually means. We will also look at snow cover, wildfire smoke, roof pitch and shade, how to read an annual production estimate, and how efficiency and lifespan play out over 25 years. Finally, we will explain what output swings mean for sizing and savings. West Winds Holdings provides consultations and works with qualified installation partners, so you can ask better questions before you buy.
Why a Nameplate Rating Is Not Your Kelowna Production Number
If you have looked at a solar quote, you have seen a number like 8 kW. That is the nameplate rating: the direct-current capacity printed on a panel datasheet, measured in a lab under Standard Test Conditions. Standard Test Conditions means a specific light intensity and temperature, with no snow, smoke or shade.
Your roof in the Central Okanagan is not a lab. A Kelowna system might reach its rating on a clear, cool June afternoon, but it will deliver less across a full year of snowy weeks, smoky August afternoons and long December nights. Peak-sun marketing quotes the best hours of the best day, while an annual production estimate in kilowatt hours (kWh) averages every hour of every season.
This piece is here to teach you to read that annual kWh number and to ask your installer what assumptions sit behind it.
One caution up front: this article does not publish a Kelowna irradiance, snow-loss or smoke-loss figure. Trace those numbers to Natural Resources Canada's solar resource data or published research before you rely on them.
How Do Solar Panels Work, in Plain Terms?
Now that the nameplate number is in perspective, here's what happens on your roof. Photovoltaic cells absorb sunlight and convert it into direct current (DC). An inverter then changes that DC into the alternating current (AC) your home uses. Output rises and falls with irradiance, which is simply how much sunlight reaches the panel surface. Output also slips a little as panel temperature climbs.
The units trip people up: kW is capacity, while kWh is energy delivered over time. Quotes usually show kW; your utility bill shows kWh. Here's the reassuring part: clouds, smoke and snow do not switch a panel off. They reduce the light reaching the cells, so production drops rather than stops. The 2024 Pembina Business Renewables Centre-Canada article Neither snow nor...smoke will stop solar panels from delivering energy examines this in more detail. Check the full text before quoting any figure from it.
The Okanagan Advantage: Real Irradiance for Solar Panels in Kelowna
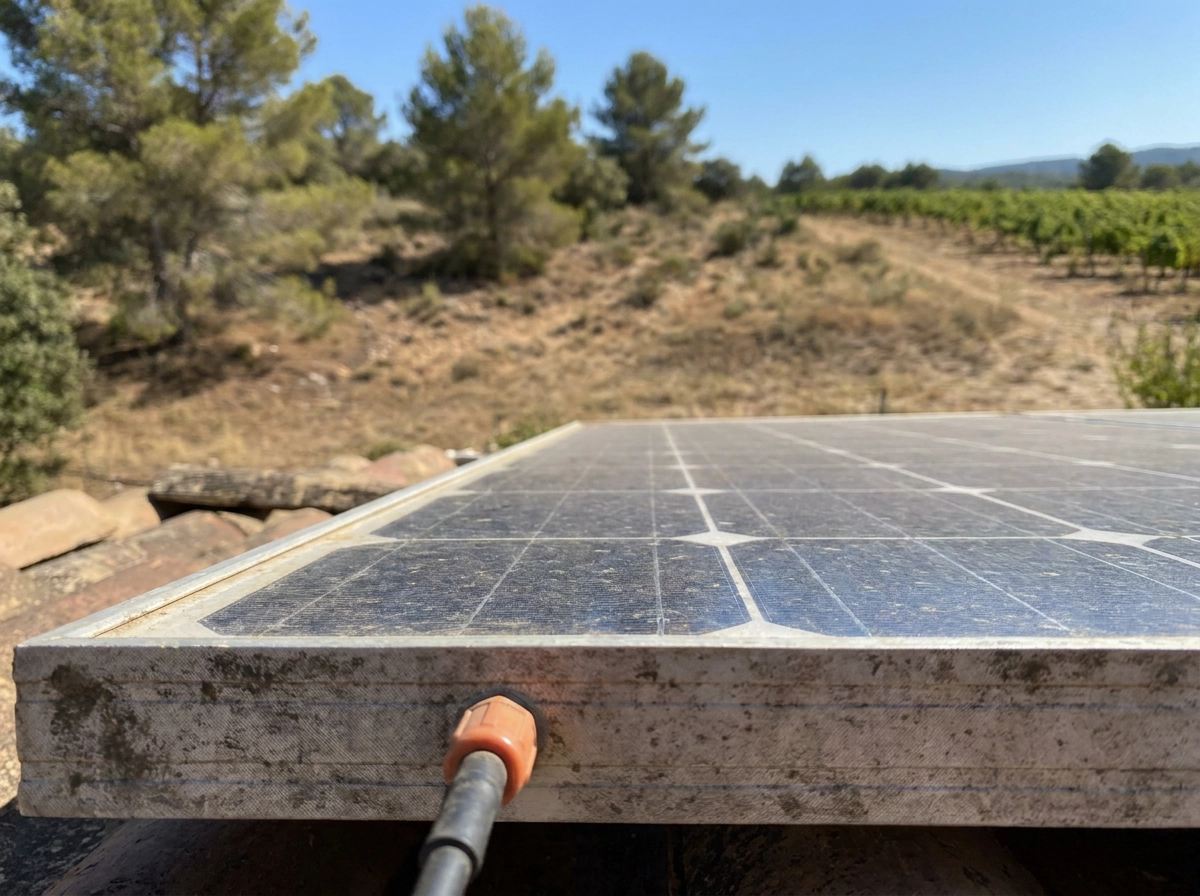
So irradiance is the variable, and location is what sets it. Kelowna sits in a genuinely sunny interior region, a real advantage over coastal BC, where cloud cover is heavier. This piece won't quote a peak-sun figure for Kelowna because we haven't verified one; pull the current value directly from NRCan's solar resource data instead.
Natural Resources Canada's photovoltaic potential and solar resource maps are the place to compare Kelowna against other BC locations on consistent data rather than a marketing claim.
A production estimate should be built from that local irradiance data, not a generic national average or a number copied from a manufacturer brochure. Global horizontal irradiance is a simplified approximation that doesn't fully describe real PV potential, since local temperature, wind, snow, dust and pollution all modulate it.
So ask any installer which dataset and location they used, and whether shading, snow and soiling losses are already applied. If the answer is vague, so is the estimate.
Snow Cover: What Kelowna Winters Do to Output
Snow sitting on a panel blocks light, so output drops while the array is covered. The good news is that clearing often happens on its own: as panels warm slightly and snow loosens, it slides off a tilted roof.
Roof pitch matters here. A steeper tilt sheds snow faster than a shallow one, and in the Okanagan that difference counts for more than it does in milder coastal markets where snow disappears quickly anyway.
Winter losses are seasonal and concentrated. They pull down your annual total, but they do not mean the system has failed or was sized incorrectly. They also vary year to year: a heavy snow winter generates less than a light one at the exact same address, even with identical equipment.
So ask your installer how their estimate handles snow, which dataset they use and what loss assumption sits behind it. Researchers estimate snow losses directly from a system's own daily generation data and note that models are most reliable at the annual level, so treat a rule-of-thumb percentage with caution and check the Pembina article and NRCan's solar resource data instead.
Summer smoke does something similar, which the next section covers.
Wildfire Smoke and Summer Production
Winter snow is the obvious seasonal brake; summer smoke is the sneakier one. Smoke particles scatter and absorb incoming sunlight before it reaches your panels, so the array keeps working on dimmer fuel. That is a real but partial reduction, not a blackout.
How much you lose depends on smoke density, how high the plume sits and how long it lingers over your roof. A thick, low blanket that parks for days bites harder than a thin haze drifting through. Loss windows vary widely from one Okanagan summer to the next.
Timing sharpens the sting. Smoke tends to arrive in July and August, exactly when clear-sky output would otherwise peak. Losing 10 percent in a high-production month costs more kilowatt hours than losing the same share in December.
The National Renewable Energy Laboratory has researched how wildfires affect solar generation and grid operations. Those findings explain the mechanism, not a Kelowna-specific loss figure. A credible annual estimate spreads smoke losses across the year instead of promising clean-sky performance through midsummer. Ask any installer how their number accounts for smoke.
Roof Pitch, Orientation and Shade in the Okanagan
Smoke varies year to year; your roof's geometry doesn't. Orientation comes first: south-facing slopes collect the most annual sun at our latitude, while east and west roofs produce less overall but spread output across the morning and evening.
Pitch is a tradeoff. A moderate tilt leans into summer sun while still shedding snow and catching the low winter sun angle.
Shade is the sneaky one. Trees, chimneys and neighbouring buildings bite hardest in winter, when the sun sits low and shadows stretch long across the roof, so a summer shade check can miss real losses.
NRCan's solar photovoltaic tools give you a starting read on your location. Pair them with an on-site assessment from an installer who can measure pitch, orientation and shading before you commit.
If part of your roof is shaded, micro-inverters or power optimizers can limit the hit to the affected panels. Worth asking whether your roof actually needs them.
Next: reading the annual production estimate itself.
How to Read an Annual Production Estimate for Your Home
Once orientation, pitch and shade are pinned down, you need a number you can actually check. That number is kilowatt hours (kWh) per year, not kilowatts. Compare it against a full year of household consumption from your utility bills.
Ask for every assumption in writing: which irradiance dataset was used, array orientation, pitch, shade modelling, snow and soiling losses, and inverter efficiency. Each one moves the total.
Then do a sanity check. Divide the annual kWh estimate by the system's nameplate capacity in kW to find the implied hours of full-output production. If that figure looks unusually high, push back. A round "95% performance" claim means nothing without the inputs behind it.
Request a range, not one figure, and ask which weather years it covers. A single optimistic number is a sales number, not an estimate.
Keep the estimate document on file so every quote is compared on the same basis. After your first full year of operation, check actual production against it and ask what the gap tells you.
Solar Panel Efficiency and Solar Panel Lifespan Over 25 Years
Your annual estimate tells you what the roof delivers. Efficiency is a different question. It is simply how much of the sunlight striking a panel actually becomes electricity, a manufacturing specification. A higher-efficiency panel does not automatically mean more annual kilowatt hours; orientation, shade and weather still decide that.
Panels do wear slowly. Expect a small decline each year, often under a percentage point, so ask for the published degradation rate and the warranty floor in writing.
Lifespan is bigger than the panel. Count the warranty period plus how long the inverter and other components hold up. Inverters usually need attention first.
Here is the reassuring part. Snow, smoke and heat do not permanently consume a panel. Production drops while light is blocked or temperatures climb, then returns to baseline once conditions clear.
Heat is the quiet Okanagan factor: panels produce slightly less on a very hot day than a cool, bright one.
What Output Swings Mean for Sizing and Savings
Lifespan and efficiency describe the panel itself. Sizing is about matching what it makes to what you actually use.
Size against annual consumption, not your sunniest month. Build to your yearly kWh and you will still come up short in December, but build for June output and you pay for capacity you rarely need.
Then model savings month by month. A Kelowna array generates far more in June than in December, and standard utility billing may not line up with that curve.
Two open questions for your installer: how would a battery shift summer surplus into evening use, and how would a different rate plan interact with a seasonal generation curve?
Treat every savings projection as an estimate tied to your usage, your rate plan and the weather, and verify current BC Hydro programs before relying on any figure.
Finally, ask what happens in a poor snow year or a heavy smoke year. A range is far more useful for planning than a single best-case number.
Conclusion: Ask for the Annual Number, Not the Peak
So where does that leave you? Kelowna is a genuinely good solar location. The honest number, though, is annual yield measured through local weather cycles, not a peak-sun rating pulled from the best hours of the clearest day.
Read the kWh per year estimate, ask what assumptions sit behind it, and expect real variation between a smoky summer and a snow-heavy winter.
When a figure sounds too good, trace it. Irradiance, snow loss and smoke loss all belong to Natural Resources Canada solar resource data or published research, not a brochure.
West Winds Holdings is Kelowna based. We help homeowners understand their energy needs and connect customers with our qualified installation partner, Energy Economics.
If you want a straight answer for your own roof, request a no obligation local solar consultation to talk through an annual production estimate for your property, the assumptions behind it, and what a poor snow year or a heavy smoke year could mean.